Housing Vulnerability in the Fort McMurray Wildfire
Link to the full analysis available here.
Wildfires have become more dangerous and intense in the past decades, along with an increasing urban growth in wildfire-prone areas. These areas are known as the Wildland-Urban Interface (WUI), in which forest and wildland fuels intersect with human development. Not only does this urban expansion put humans more at risk from wildfires, it also creates more of them as humans are the leading cause of wildfires, especially in the WUI. Fort McMurray is a classic example of one such WUI area, having increased its population by over 70% in just 15 years and being surrounded by highly flammable boreal forest. A Google Earth Engine timelapse shows the extent of the rapid urban growth over the past three decades and the increase of the WUI. In May of 2016, a devastating wildfire swept through the city of Fort McMurray, destroying over 2400 buildings and forcing the evacuation of over 80,000 people - it later became known as the costliest natural disaster in Canadian history. As natural disasters are known to disproportionately affect the poor, I wanted to look at which areas of the city were damaged and identify any trends related to dwelling density and median household income. In addition, I was curious if FireSmart practices may have played a role in reducing the damage of the wildfire.
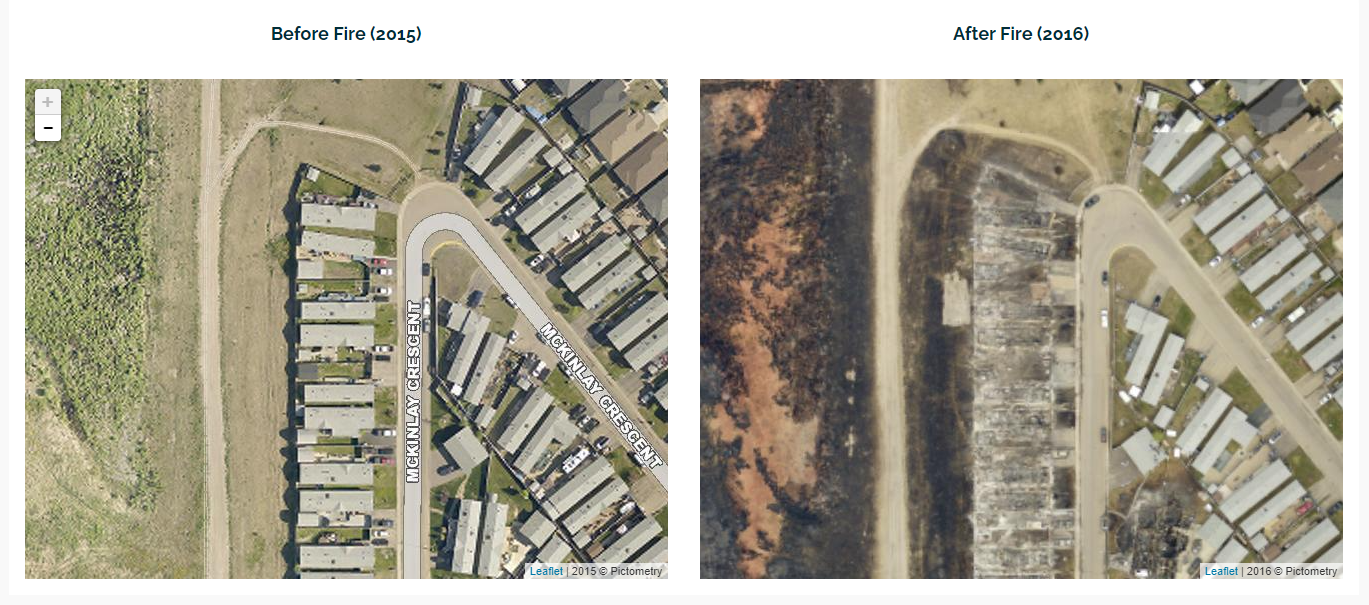
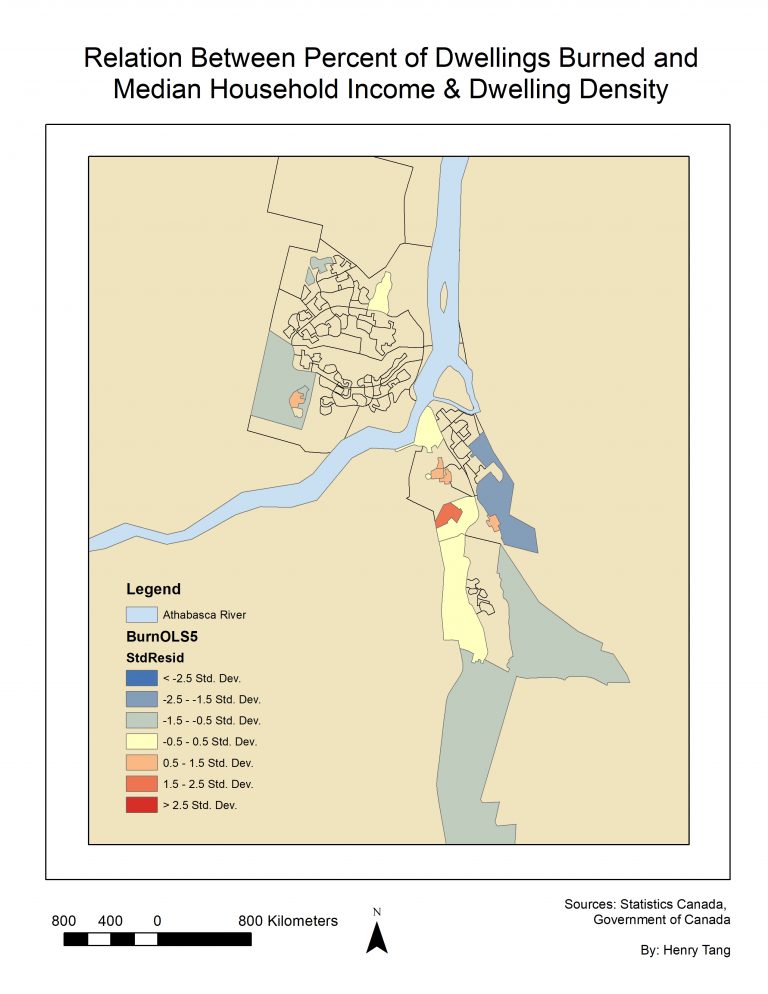
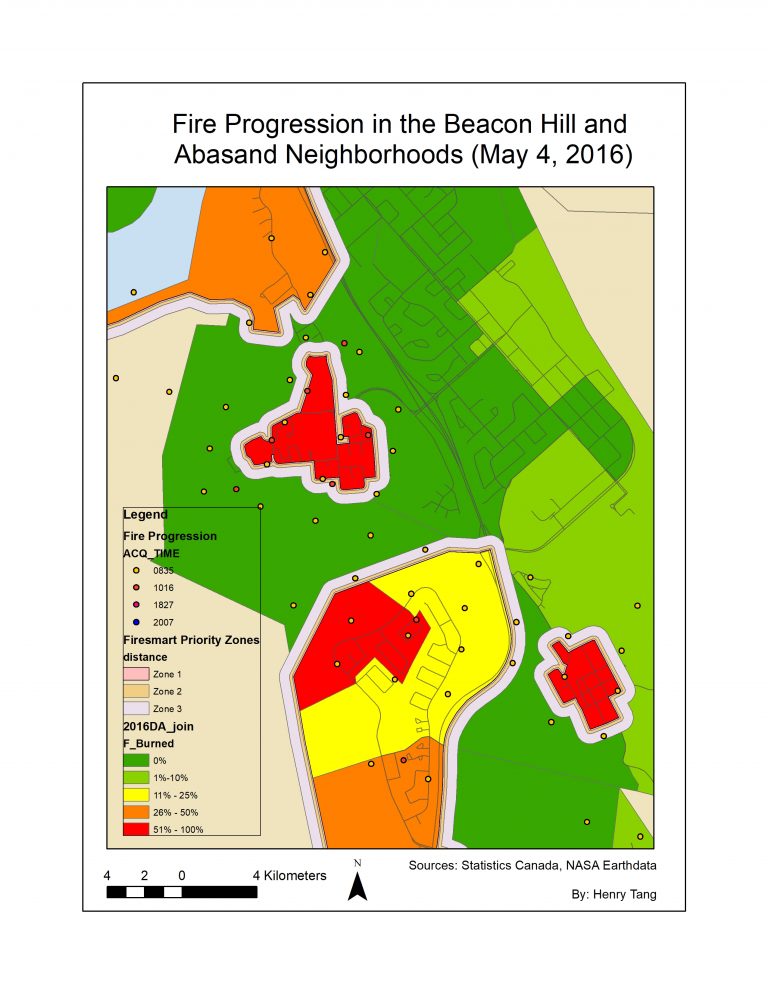
Using a comparison map from the Regional Municipality of Wood Buffalo, I zoomed in to each dissemination area and counted the number of burned/destroyed dwellings. Next, I performed an OLS regression using the percent of dwellings destroyed in a dissemination area as the dependent variable and both housing density and median household income as independent variables. As seen below, there was no strong correlation between these variables. In addition, buffers were created around the hardest hit dissemination areas for FireSmart recommended Priority Zones of 10m, 30m, and 100m. These buffers did not appear to impede the development of the wildfire and satellite images show that many neighborhoods were either in close proximity to the forest or to urban green areas with no firebreaks. Although there were no direct casualties from the wildfire, with better preparation and fire management practices, many more homes could have potentially been saved.
This was a very basic analysis of fire vulnerability based off of my limited GIS skillset and knowledge at the time. The quality of the maps created also leave a lot to be desired, as seen above. This analysis was performed on a macroscopic scale largely based on dissemination areas but many factors, on the level of an individual dwelling, may have impacted the spread and destruction of the wildfire as well. I also did not incorporate wind data but this likely had a significant effect on the travel direction of the wildfire. In the future, I hope to revisit this analysis to add more detail and also see if FireSmart practices have improved since the tragedy in 2016.