UBC SEEDS Compost Bin Contamination
Link to the full report (pdf) available here.
The Social Ecological Economic Development Studies (SEEDS) Sustainability Program at the University of British Columbia (UBC) collaborates with students and faculty to develop sustainable ideas, policies, and practices on campus. My team was tasked by the Campus & Community Planning department to find the locations of all the compost bins on campus and collect data for each collection site (this report covers the northern half of campus only). The department wanted to plan more effective routes for their waste management trucks but lacked knowledge of the bin locations as they were often moved around according to demand. In addition, the department wanted to know if there was any correlation between accessibility of the bins and contamination levels. Over the course of three consecutive weeks, we used ArcGIS Collector to collect the following data:
| Field | Description |
|---|---|
| Date | Date of data collection |
| Location | Location of bin collection site, manually pinned on ArcGIS Collector |
| Number of Bins | Amount of compost bins at each bin collection site |
| Bin Fullness | Visual assessment of how much compost was in the bin, measured by % |
| Contamination Rating | Rating on scale of 1 - 5 for entire site after looking through each bin |
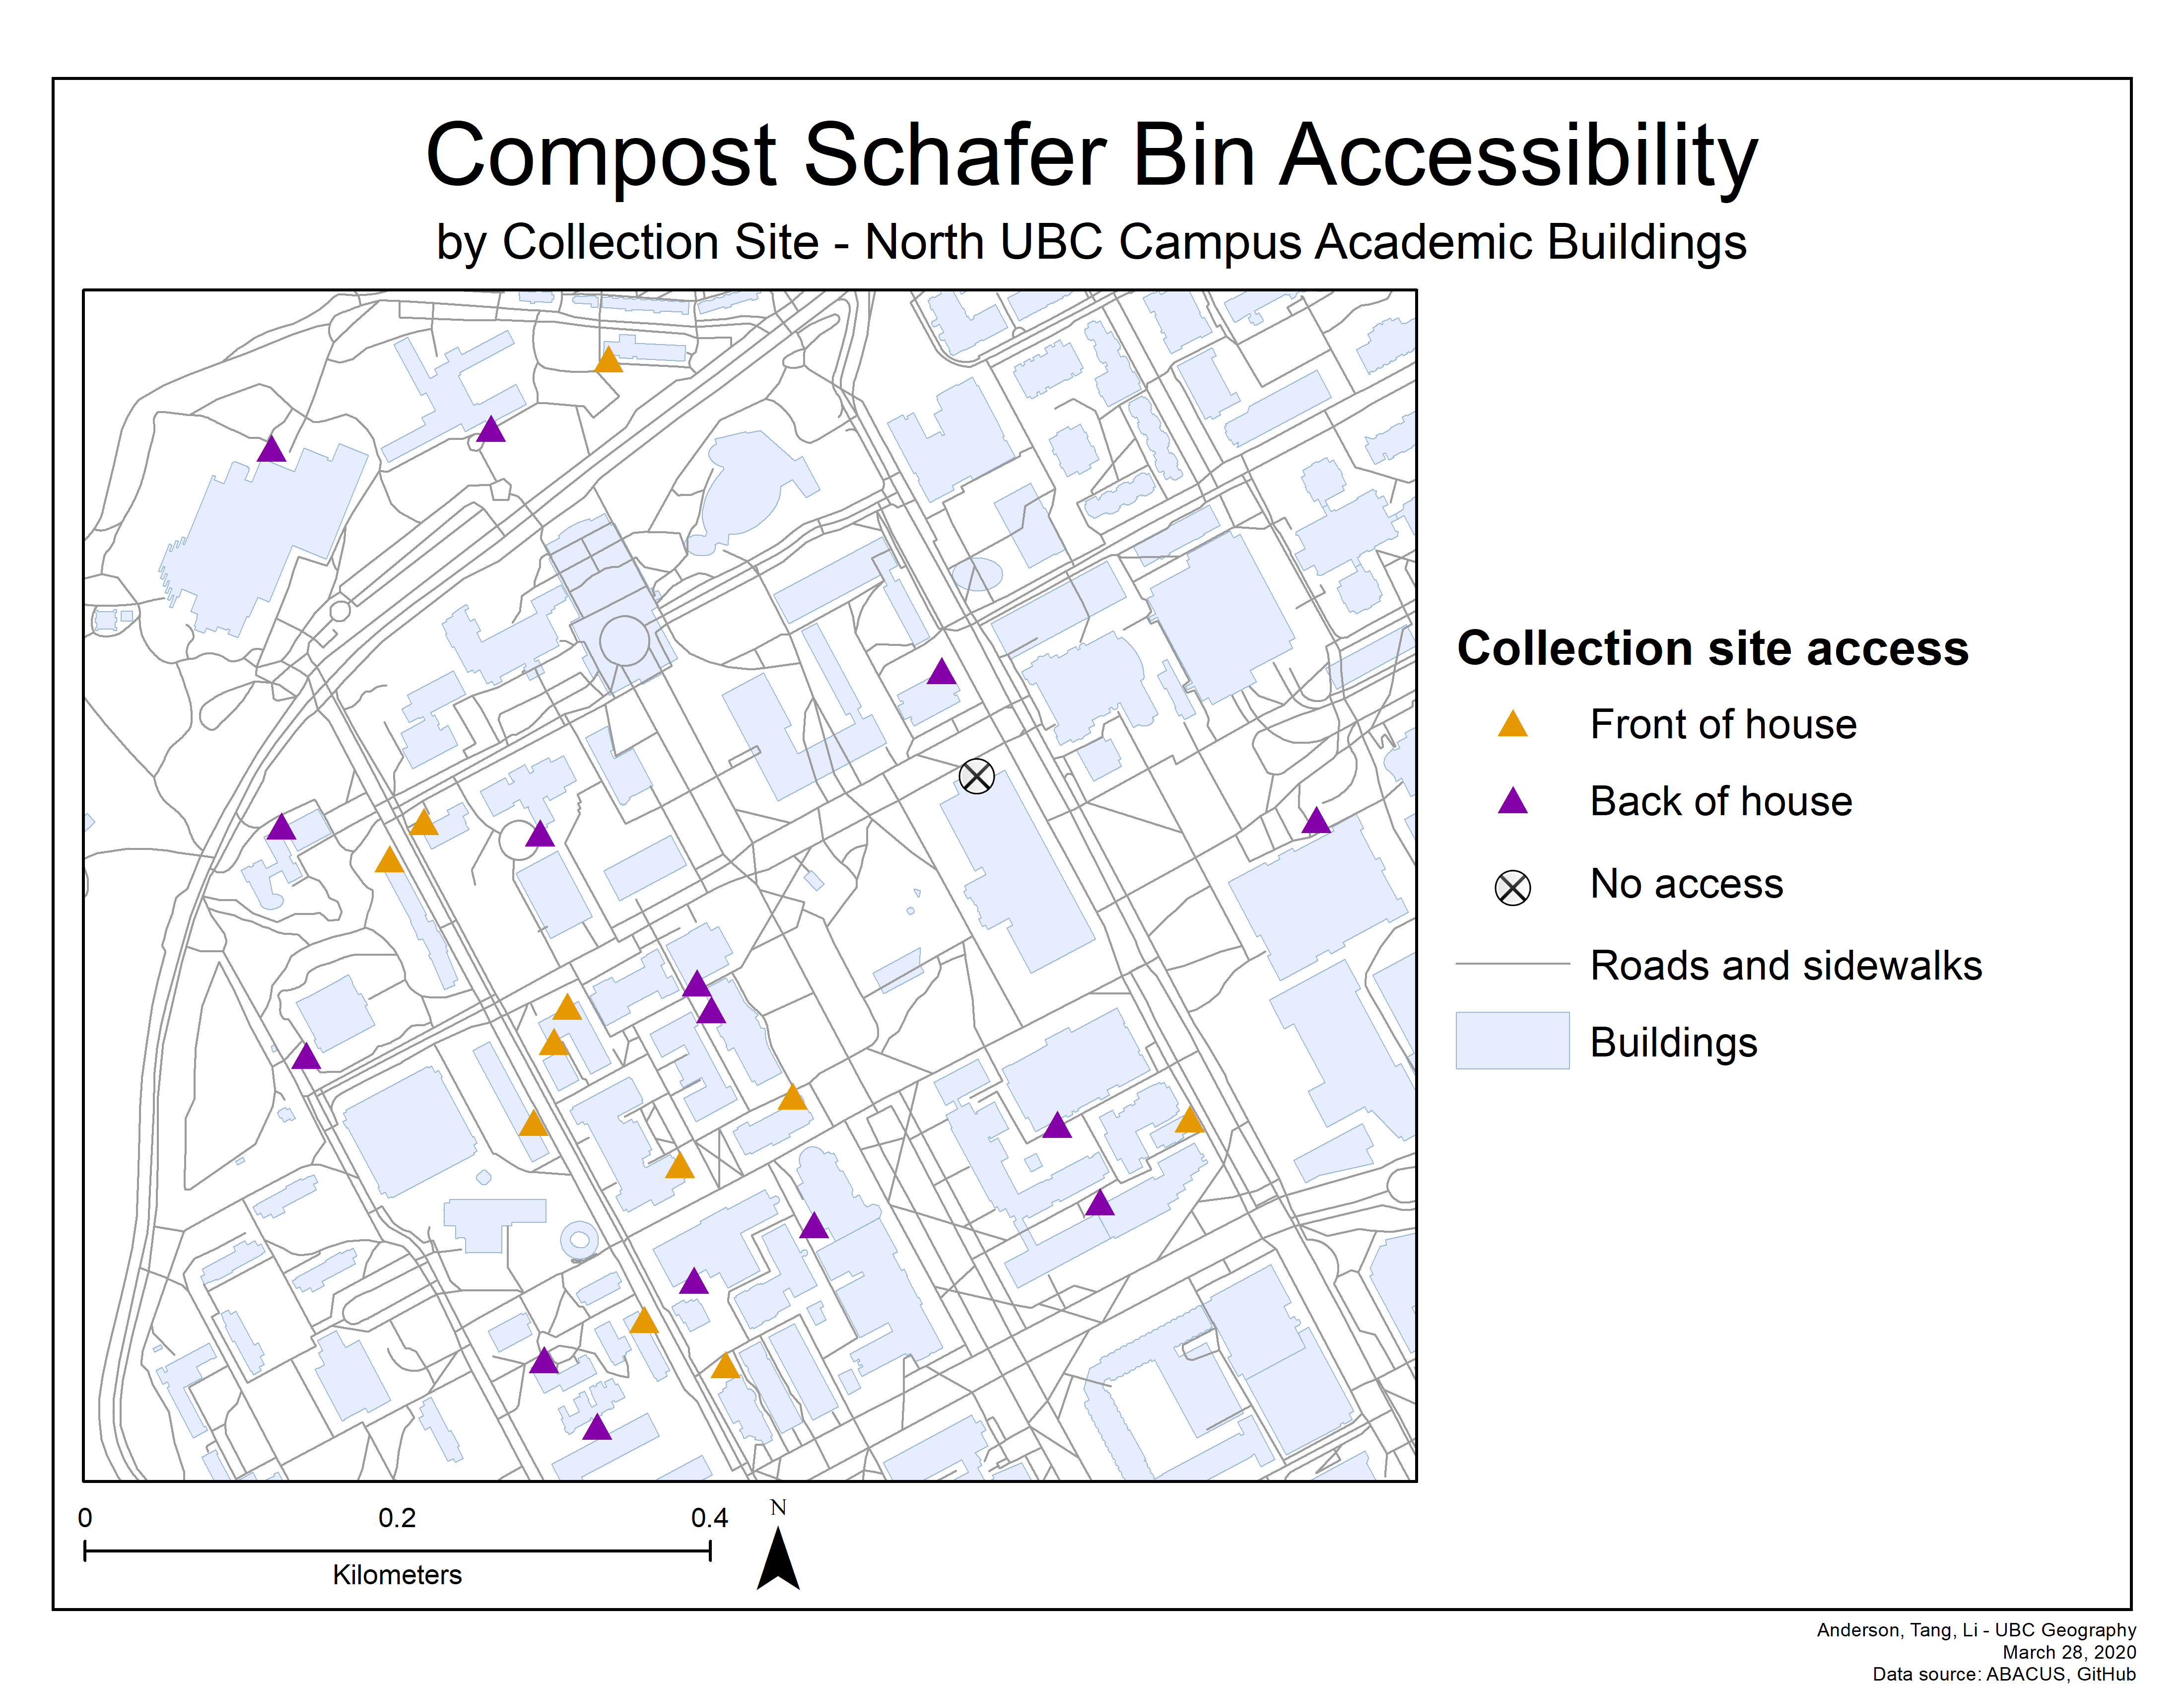
| Accessibility | Location of bin collection site relative to building entrances and major walkways |
| Photos | Added if there were bins with exceptionally high levels of contamination |
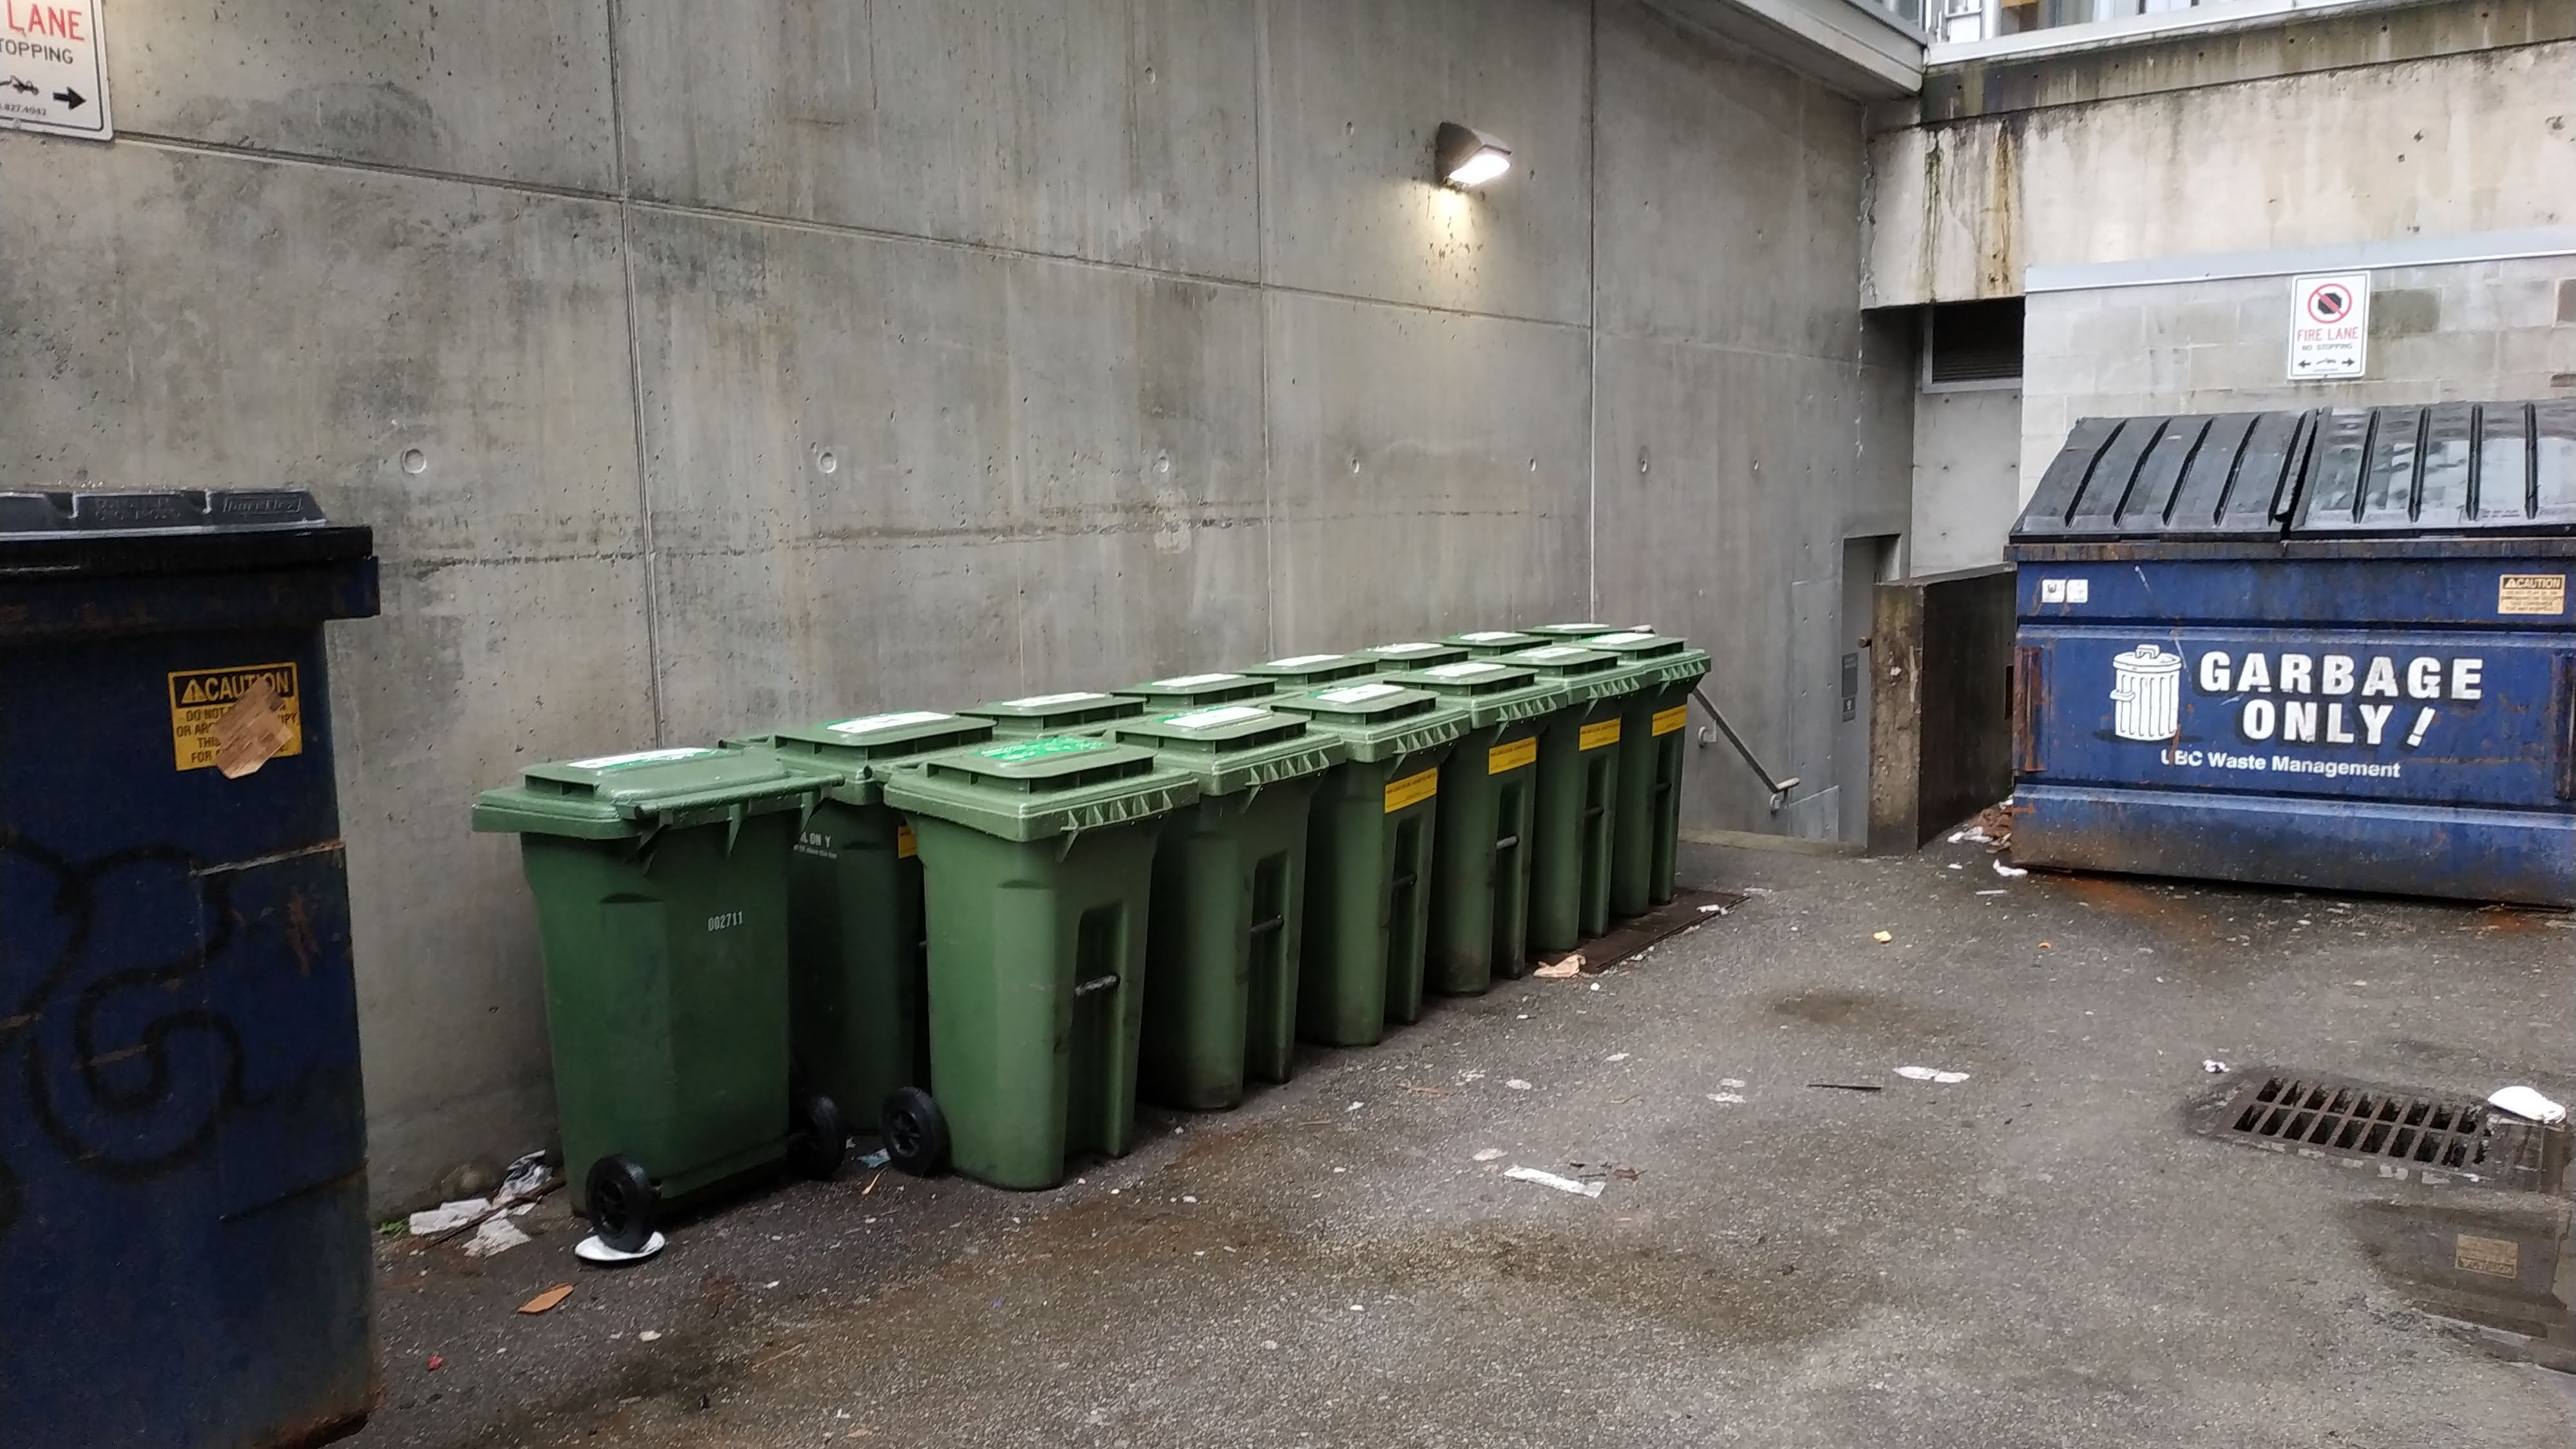
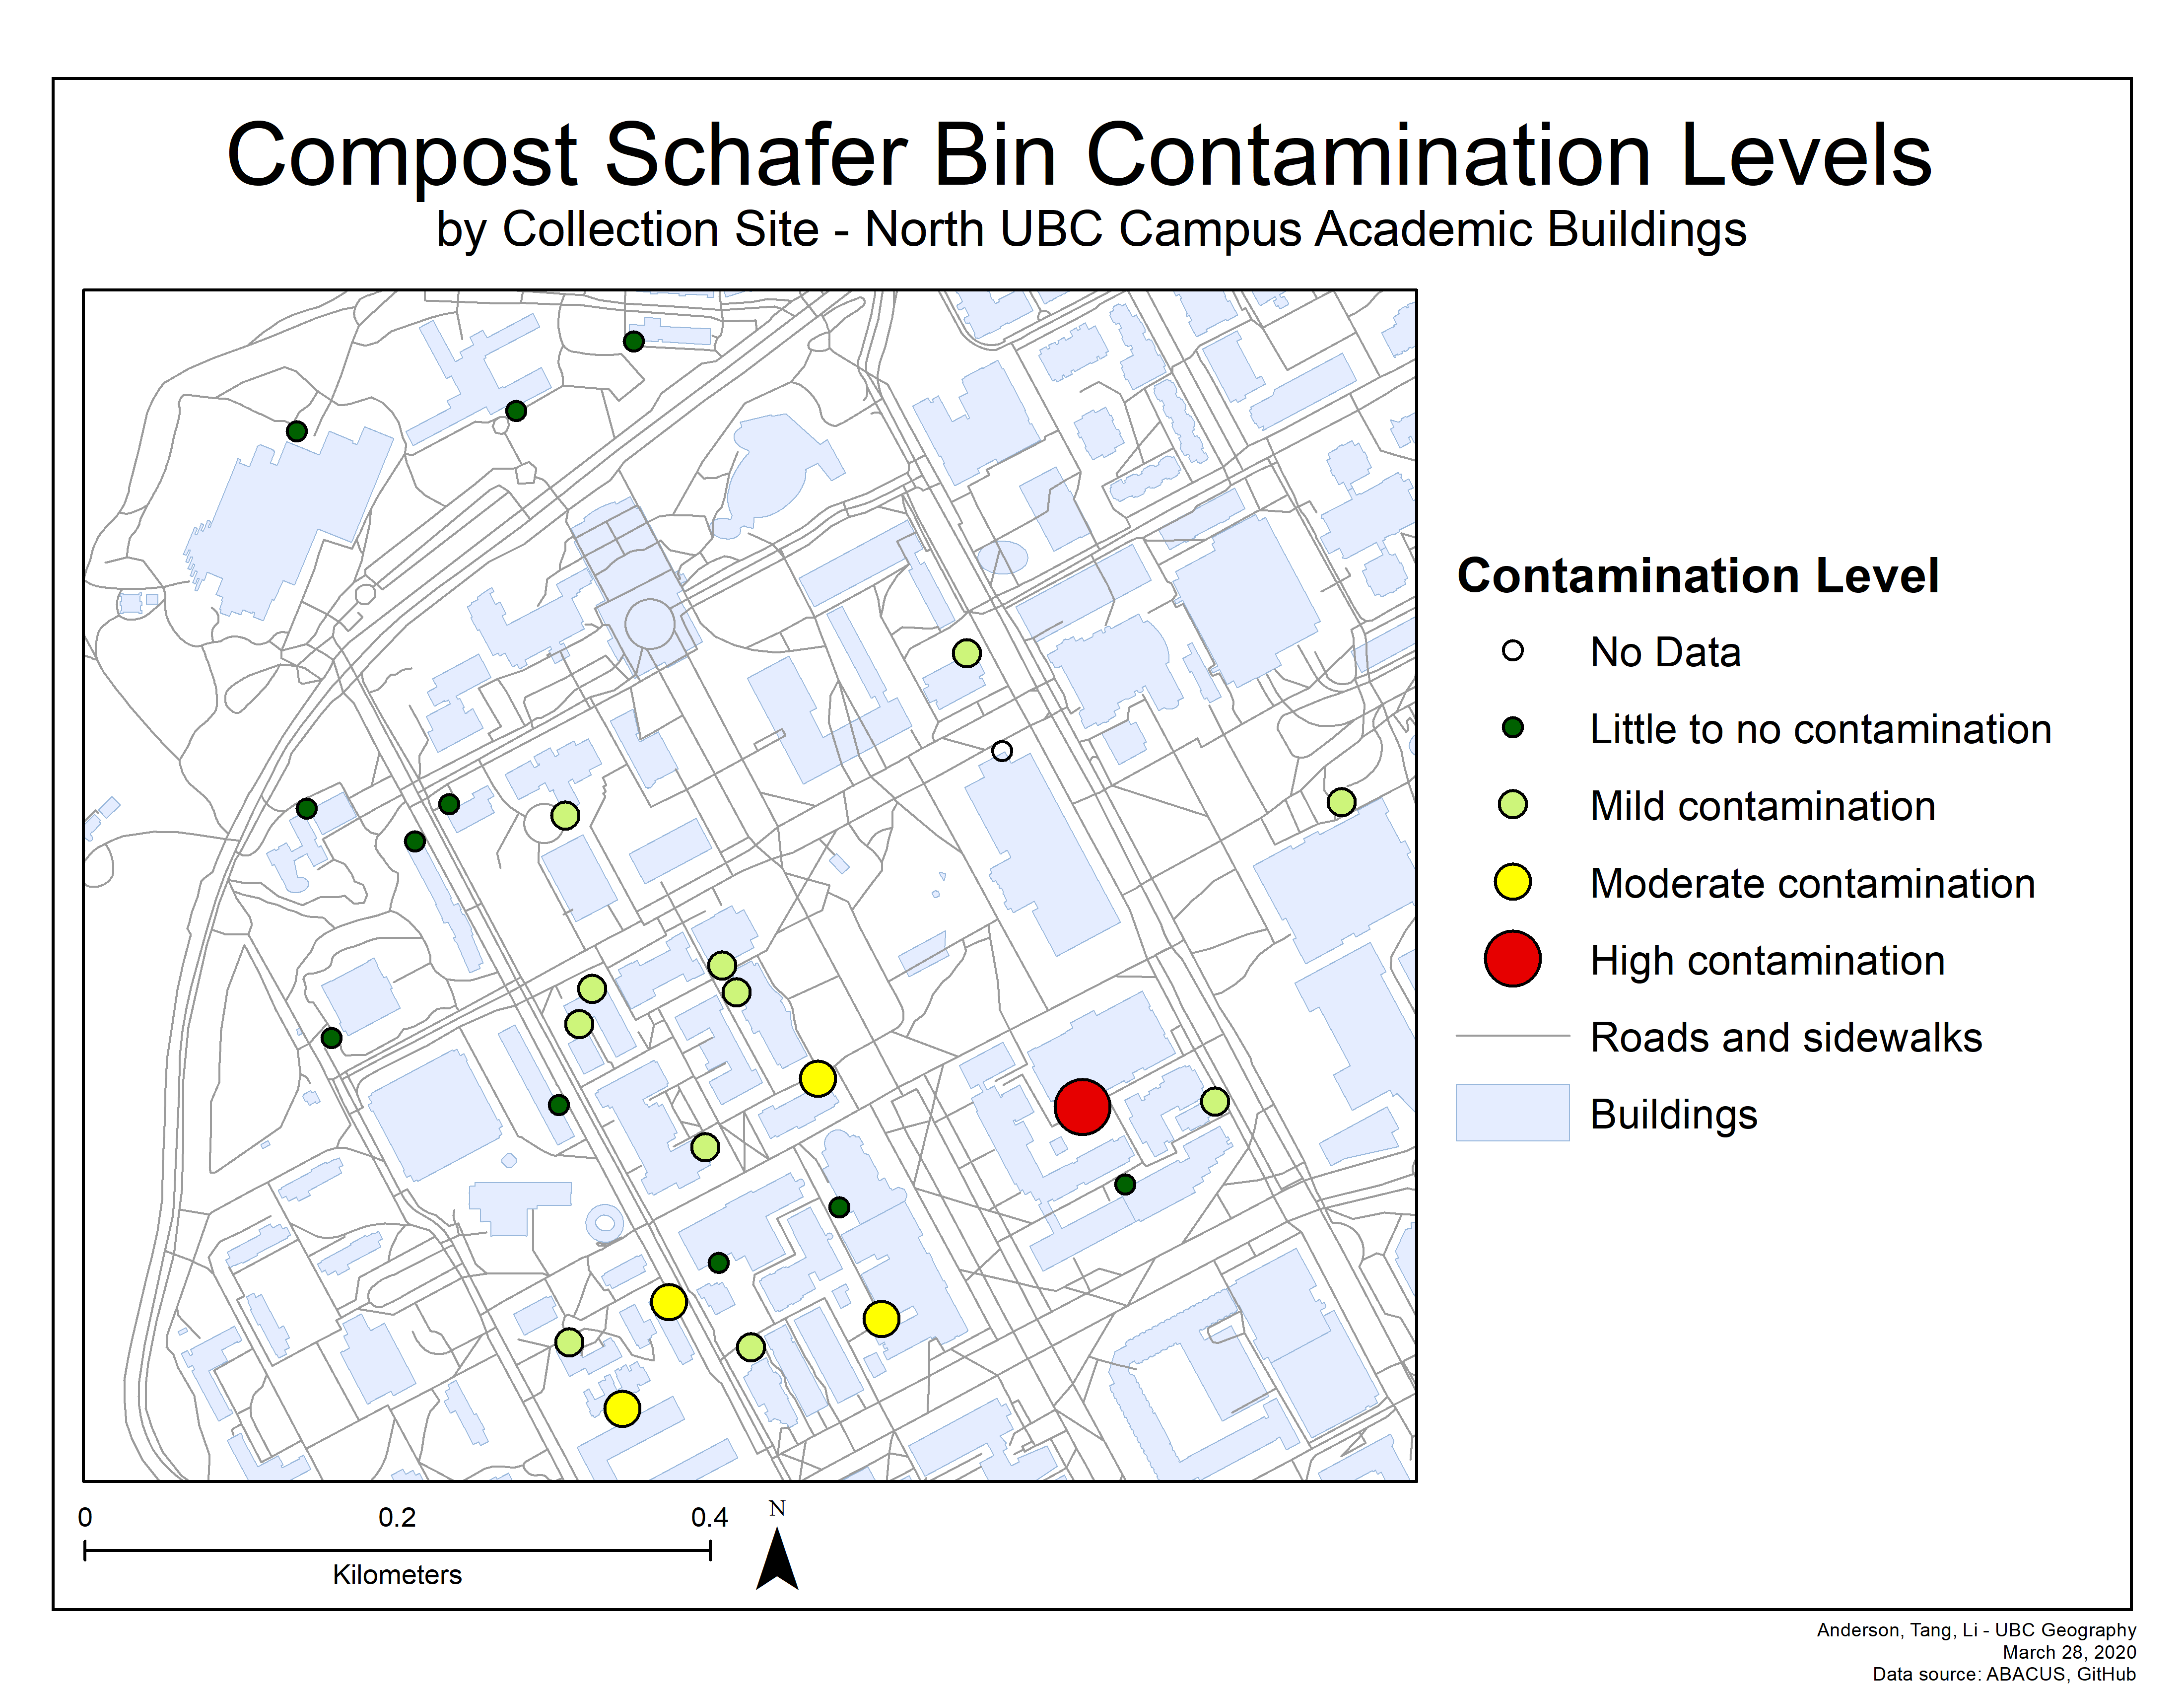
Not all of the bin collection sites were as neat and tidy as the one pictured above unfortunately, and I received more than one strange look from passersby as I dug through the bins. After collecting and sorting the data, we used ArcMap to visualize the bin accessibility and contamination levels. As seen in the below figures, there was no clear correlation between the accessibility of the collection site and the level of contamination. Despite front of house (FOH) collection sites being situated next to main entrances and along popular paths, they had similar contamination levels as the back of house (BOH) sites. However, there was a trend of higher contamination rates near the center of campus, likely because the most frequented buildings were located there.
In our presentation to Campus & Community Planning, we recommended that some sort of visual or physical blockade be constructed at front of house locations. Over 40% of the sites were classified as FOH and despite not having a higher rate of contamination, there was still evidence of outside contamination. We also recommended that compost bins be redistributed from the Sauder building as there were at least 10 empty bins there every time we did data collection. Furthermore, bin signage and composting education could be improved as the most common type of contamination observed was improper disposal of food and drink containers.